coroot - A monitoring and troubleshooting tool for microservice architectures.
Coroot is a monitoring and troubleshooting tool for microservice architectures.
Features
eBPF-based service mapping
Thanks to eBPF, Coroot shows you a comprehensive map of your services without any code changes.
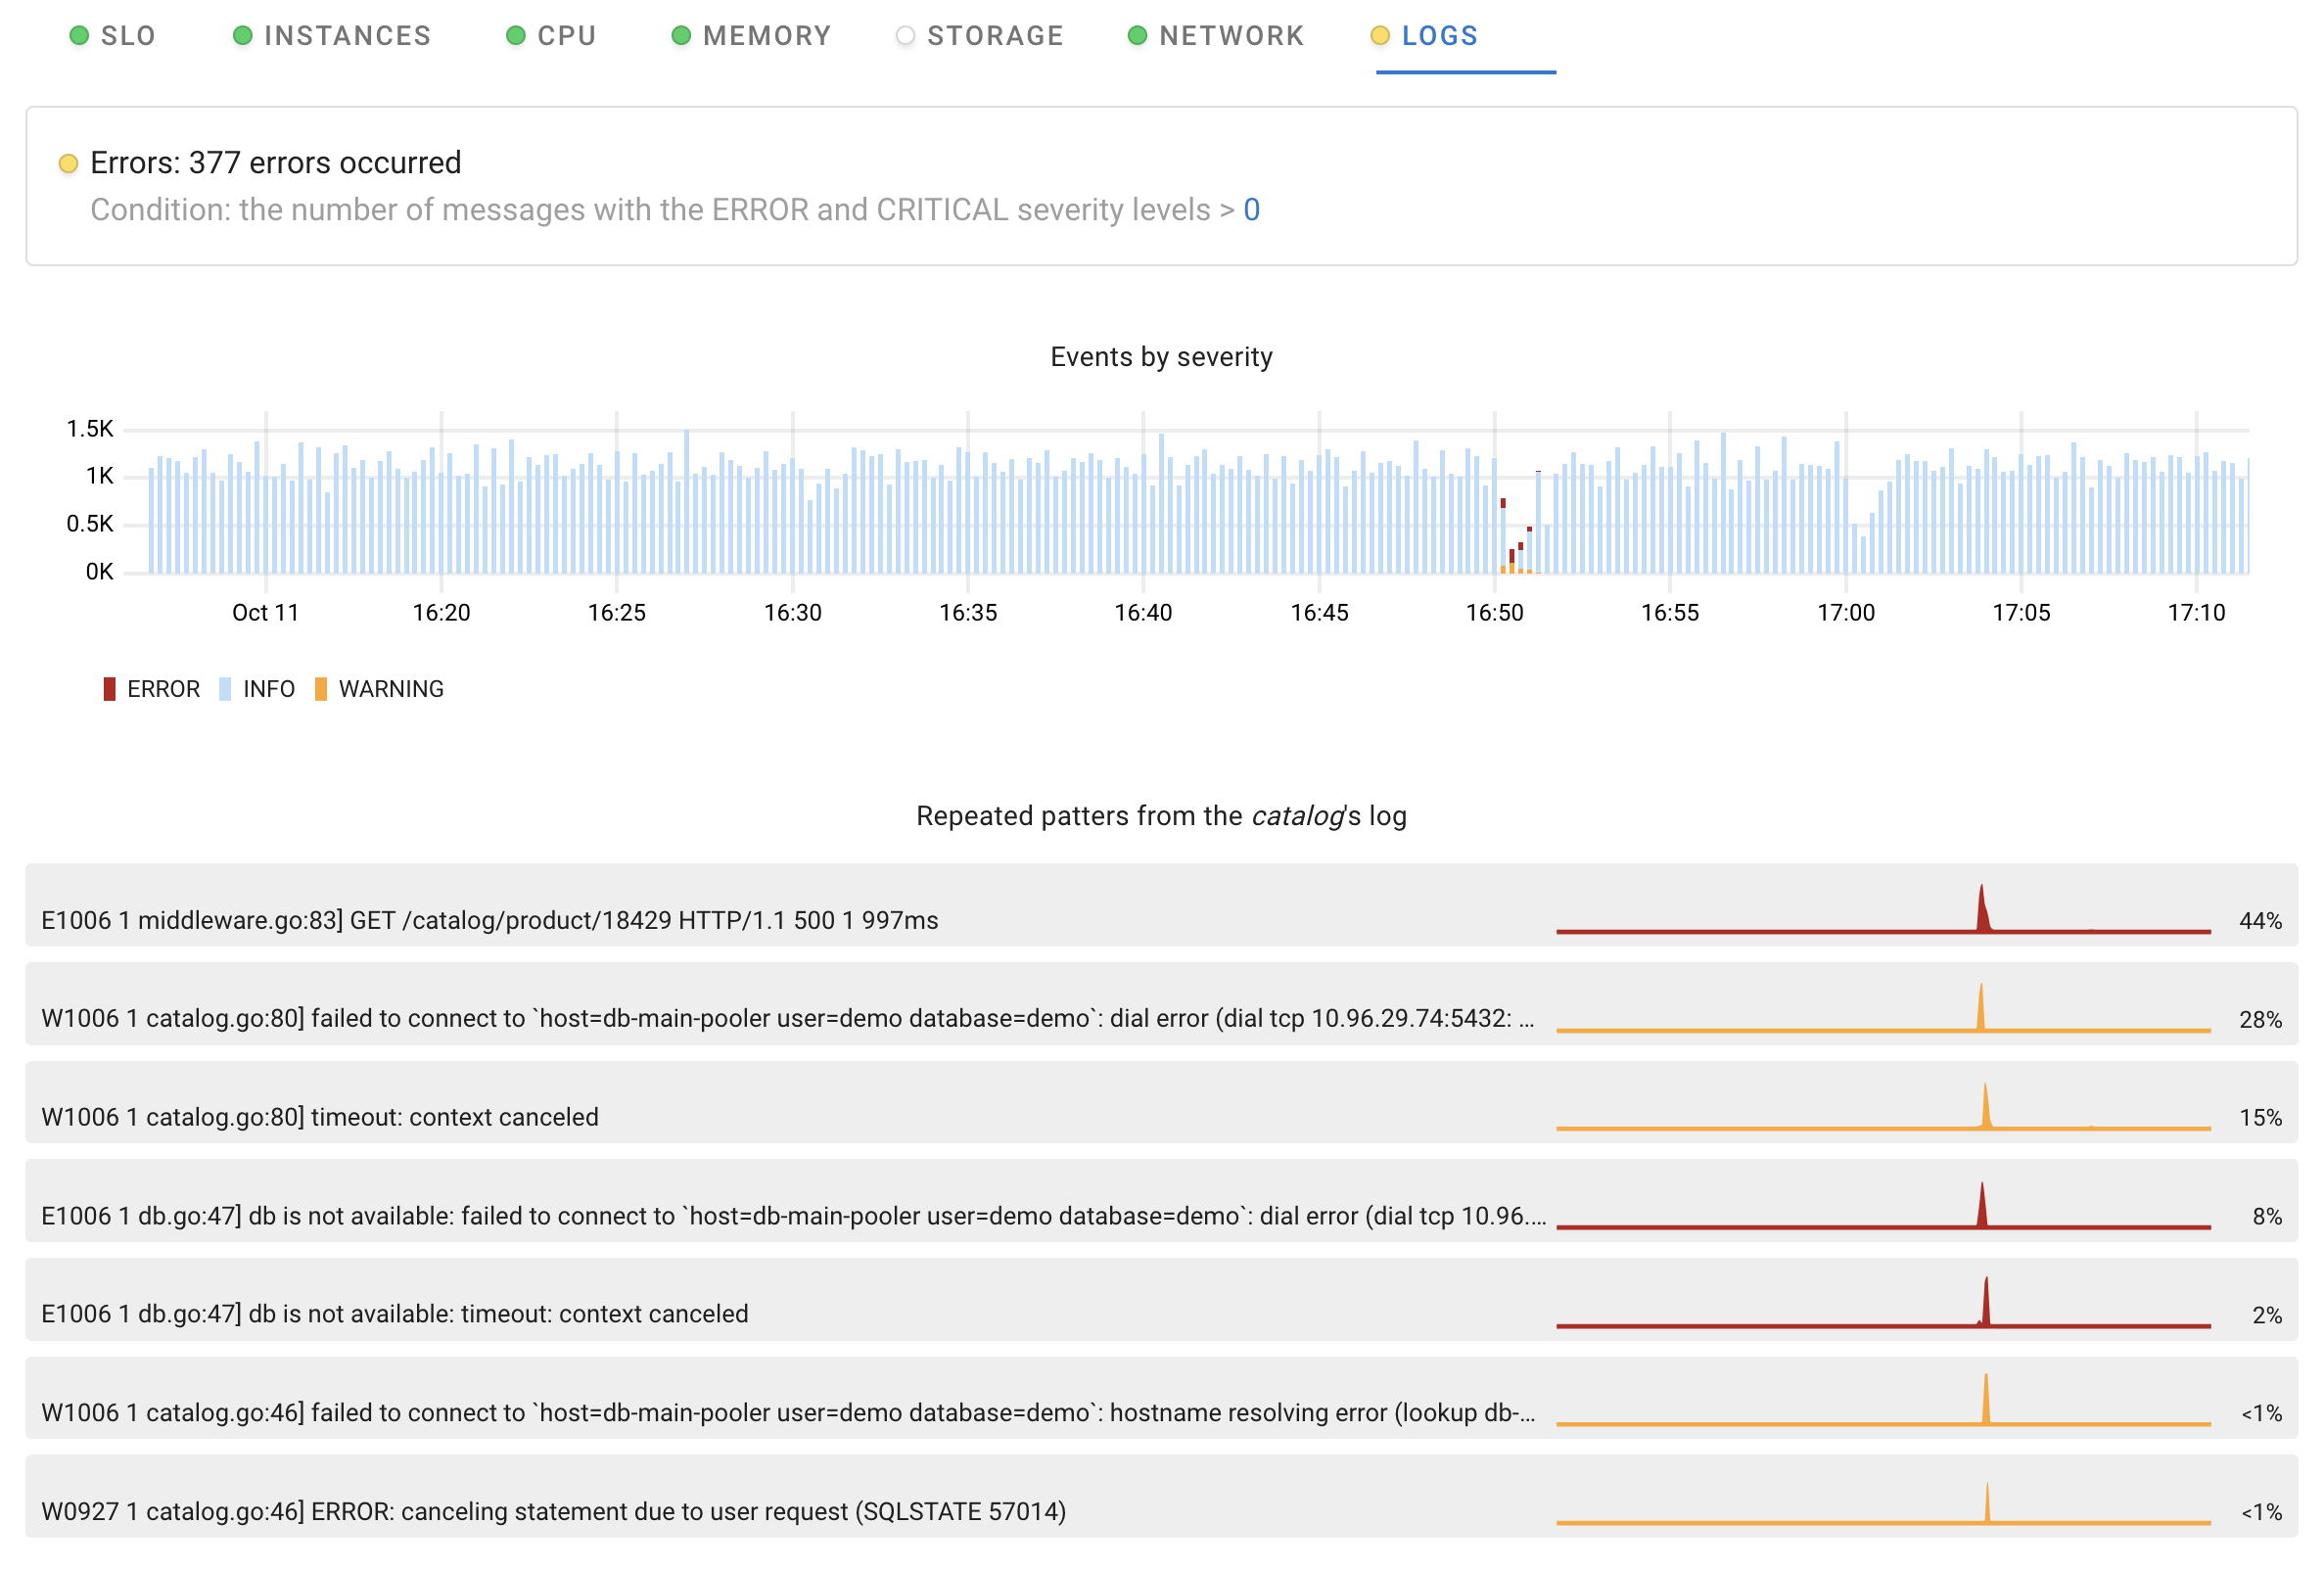
Log analysis without storage costs
Node-agent turns terabytes of logs into just a few dozen metrics by extracting repeated patterns right on the node. Using these metrics allows you to quickly and cost-effectively find the errors relevant to a particular outage.
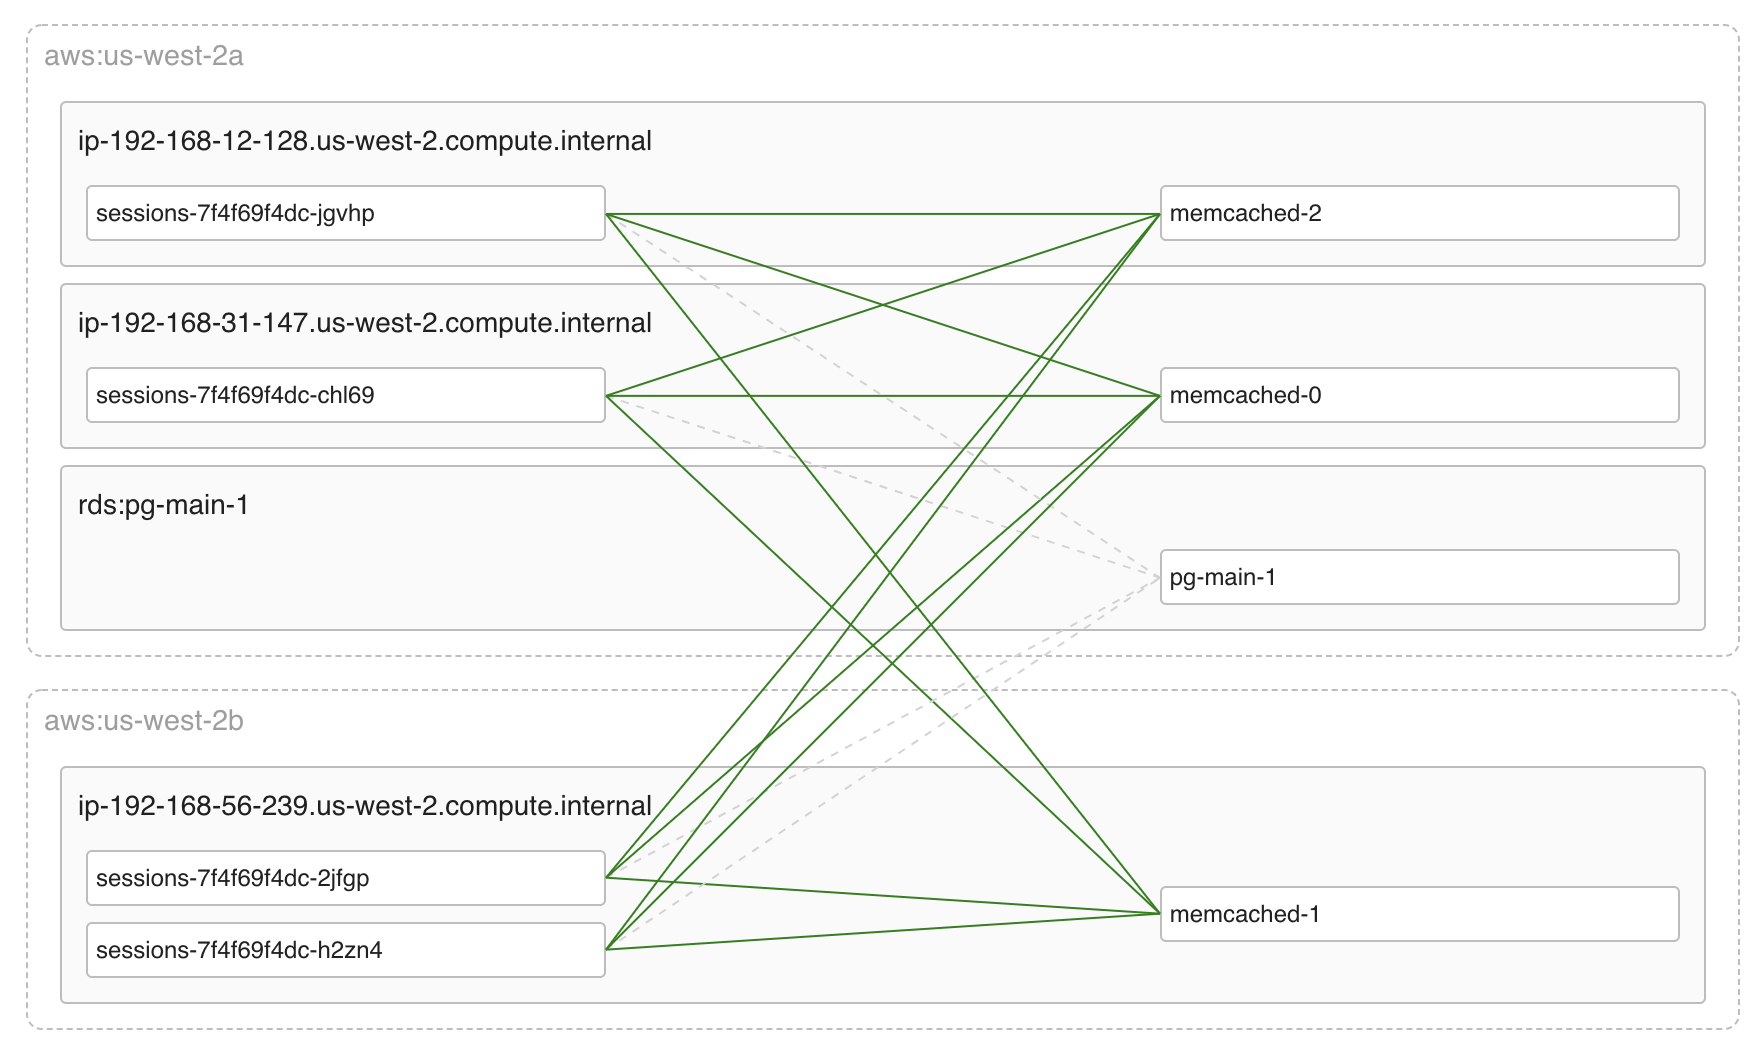
Cloud topology awareness
Coroot uses cloud metadata to show which regions and availability zones each application runs in. This is very important to known, because:
- Network latency between availability zones within the same region can be higher than within one particular zone.
- Data transfer between availability zones in the same region is paid, while data transfer within a zone is free.
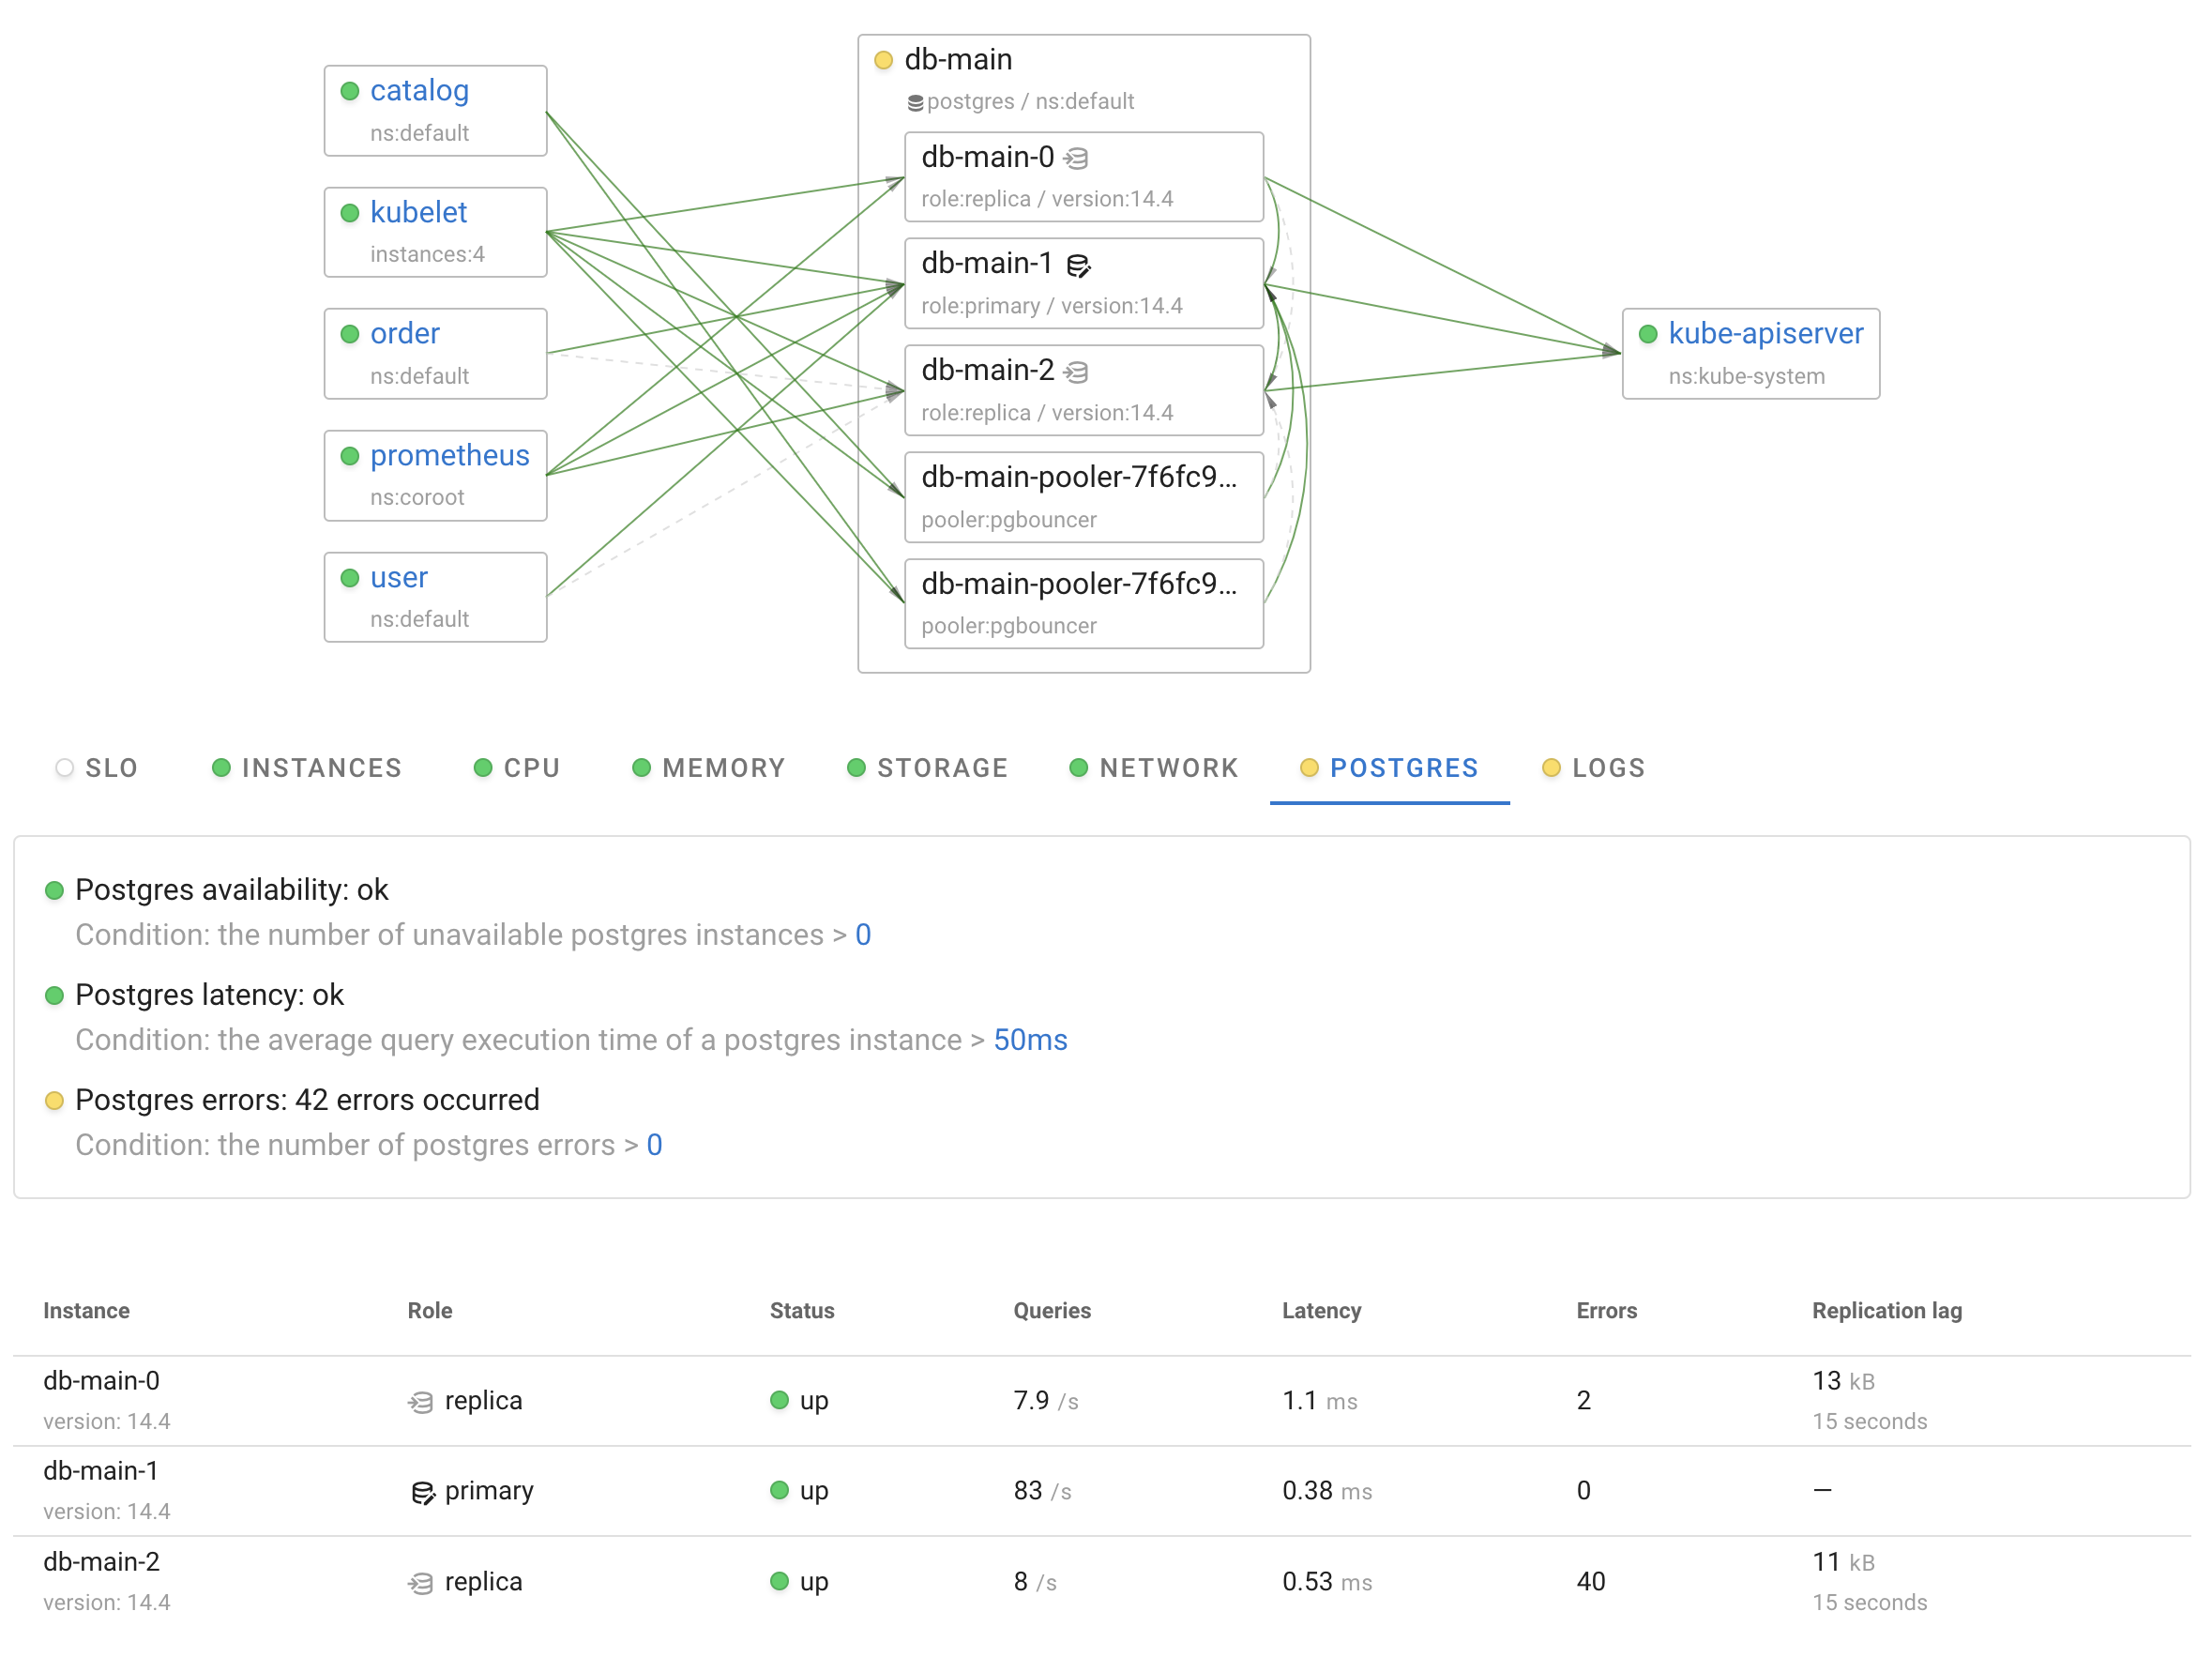
Advanced Postgres observability
Coroot makes troubleshooting Postgres-related issues easier not only for experienced DBAs but also for engineers not specialized in databases.
Integration into your existing monitoring stack
Coroot uses Prometheus as a Time-Series Database (TSDB):
- The agents are Prometheus-compatible exporters
- Coroot itself is a Prometheus client (like Grafana)
Built-in Prometheus cache
The built-in Prometheus cache allows Coroot to provide you with a blazing fast UI without overloading your Prometheus.
Installation
You can run Coroot as a Docker container or deploy it into any Kubernetes cluster. Check out the Installation guide.
Documentation
The Coroot documentation is available at coroot.com/docs/coroot-community-edition.
License
Coroot is licensed under the Apache License, Version 2.0.


